과제목표
전세계적인 코로나 19 바이러스의 발병 case와 사망률, 백신 보급률의 증감이
대한민국 항공 국내/국제선 이용률에 미친 영향을 시각화 및 분석하기
개발도구
- Python
- Selenium Crawling, Pandas : 데이터 수집 및 전처리, 정제
- Matplotlib, seaborn : 시계열 데이터 EDA 및 시각화
- Tableau Public / Desktop
- Time Parameter로 시작 및 끝 지점 설정하여 데이터를 확인할 수 있는 Interactive Dashboard로 구성
데이터 소스 및 특성
Ⅰ. 항공데이터
https://www.airportal.go.kr/knowledge/statsnew/air/general.jsp

1. 시계열데이터
- 2009년 1월부터 2023년 11월까지 방대한 양의 항공 데이터
- 시간을 parameter로 설정하여 시작~끝 지점의 데이터
2. 카테고리별 분류가능
- 국제선/국내선
- 여객/화물/운항 | 공급석
- 여객
- 화물
- 운항
- 공급석 : 항공기 운용시 공급가능한 최대좌석
목표data
0. 총괄 전체 데이터 계는 큰 의미 없고 추출한 데이터의 sum()이 보기 좋을듯
1. 공항별
2. 노선별
3. 지역/국가 : 국가(IATA코드)
4. 항공사별 주체가 달라 포함시키기 애매함
크롤링
- Python 셀레니움 활용하여 웹 크롤링 진행
- 엑셀 파일로 저장
- 이후 google.sheets 에 등록 or local 사용(tableau 활용하기 위해)
- 공항별-노선별-지역/국가별 : 크롤링 파트 나눠서 진행
- 한번에 해버리면 중간에 오류 발생시 시간 낭비
- csv로 만들면 '공급석' parameter가 다르게 읽힐 수 있을까 염려중
- 추후 테스트 해보고 csv로 변환
정제 및 전처리
- 수집일자 설정 : 코로나 데이터랑 맞추기 위해 2020.01~
- 반점(,) 때매 str 문자열 될 경우 replace(',',' ')하여 제거
- 특이사항별 column 및 data 추가 & 삭제 진행
# 특이사항
- 지역/국가별
- 국가 list-up하여 key 처리 후 지역(대륙) value 추가
- 노선별
- 공항과 IATA 코드 분류
- IATA 코드 기반 위도/경도 산출하여 Tableau에 시각화
EDA
- matplotlib으로 간략하게 시계열 데이터 흐름 확인
- 시각화 위해 진행필요
Ⅱ. WHO
https://covid19.who.int/data/
The WHO coronavirus (COVID-19) dashboard presents official daily counts of COVID-19 cases, deaths and vaccine utilisation reported by countries, territories and areas. Through this dashboard, we aim to provide a frequently updated data visualization, data
covid19.who.int
1. Daily cases and deaths by date reported to WHO
Download link: https://covid19.who.int/WHO-COVID-19-global-data.csv
Field nameTypeDescription
| Date_reported | Date | Date of reporting to WHO |
| Country_code | String | ISO Alpha-2 country code |
| Country | String | Country, territory, area |
| WHO_region | String | WHO regional offices: WHO Member States are grouped into six WHO regions -- Regional Office for Africa (AFRO), Regional Office for the Americas (AMRO), Regional Office for South-East Asia (SEARO), Regional Office for Europe (EURO), Regional Office for the Eastern Mediterranean (EMRO), and Regional Office for the Western Pacific (WPRO). |
| New_cases | Integer | New confirmed cases. Calculated by subtracting previous cumulative case count from current cumulative cases count.* |
| Cumulative_cases | Integer | Cumulative confirmed cases reported to WHO to date. |
| New_deaths | Integer | New confirmed deaths. Calculated by subtracting previous cumulative deaths from current cumulative deaths.* |
| Cumulative_deaths | Integer | Cumulative confirmed deaths reported to WHO to date. |
* Users should note that, in addition to capturing new cases and deaths reported on any given day, updates are made retrospectively to correct counts on previous days as needed based on subsequent information received. See "Daily aggregate case and death count data" above for further details on the calculation of new cases/deaths.
2. Vaccination data
Download links: https://covid19.who.int/who-data/vaccination-data.csv
Field nameTypeDescription
| COUNTRY | String | Country, territory, area |
| ISO3 | String | ISO Alpha-3 country code |
| WHO_REGION | String | WHO regional offices: WHO Member States are grouped into six WHO regions: Regional Office for Africa (AFRO), Regional Office for the Americas (AMRO), Regional Office for South-East Asia (SEARO), Regional Office for Europe (EURO), Regional Office for the Eastern Mediterranean (EMRO), and Regional Office for the Western Pacific (WPRO). |
| DATA_SOURCE | String | Indicates data source: - REPORTING: Data reported by Member States, or sourced from official reports - OWID: Data sourced from Our World in Data: https://ourworldindata.org/covid-vaccinations |
| DATE_UPDATED | Date | Date of last update |
| TOTAL_VACCINATIONS | Integer | Cumulative total vaccine doses administered |
| PERSONS_VACCINATED_1PLUS_DOSE | Decimal | Cumulative number of persons vaccinated with at least one dose |
| TOTAL_VACCINATIONS_PER100 | Integer | Cumulative total vaccine doses administered per 100 population |
| PERSONS_VACCINATED_1PLUS_DOSE_PER100 | Decimal | Cumulative persons vaccinated with at least one dose per 100 population |
| PERSONS_LAST_DOSE | Integer | Cumulative number of persons vaccinated with a complete primary series |
| PERSONS_LAST_DOSE_PER100 | Decimal | Cumulative number of persons vaccinated with a complete primary series per 100 population |
| VACCINES_USED | String | Combined short name of vaccine: “Company - Product name” (see below) |
| FIRST_VACCINE_DATE | Date | Date of first vaccinations. Equivalent to start/launch date of the first vaccine administered in a country. |
| NUMBER_VACCINES_TYPES_USED | Integer | Number of vaccine types used per country, territory, area |
| PERSONS_BOOSTER_ADD_DOSE | Integer | Cumulative number of persons vaccinated with at least one booster or additional dose |
| PERSONS_BOOSTER_ADD_DOSE_PER100 | Decimal | Cumulative number of persons vaccinated with at least one booster or additional dose per 100 population |
정제 및 전처리
- Date_reported : Daily로 월별 데이터로 변환필요
- 데이터 2분류 확인
- New : 신규 / Cumulative : 누적
- 지역별 동기화 가능할까?
- Country : EDA 후 반영 여부 결정
- 잘하면 가능할듯함(지역-국가별)
- Vaccination 데이터는 시계열 EDA 해보고 계획
EDA
- seaborn으로 추세선 흐름 확인해보는 것도 좋을 듯함
시각화
https://public.tableau.com/app/discover
Discover
Explore stunning data visualizations and the talented community that creates them on Tableau Public.
public.tableau.com
Tableau Public을 활용하여 시각화할 수 있는 공개 페이지로 구성
정제한 데이터를 google sheets에 저장 후 Tableau에 활용
Ⅰ. 항공데이터
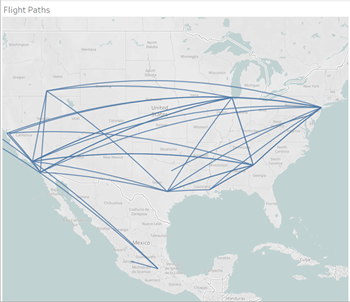
참고: https://help.tableau.com/current/pro/desktop/ko-kr/functions_functions_spatial.htm#Create2
- 국내/국제선 연결하여 시각화
- 이용량에 따른 굵기 조절 예정
- 전체 이용수의 분위별 두께 조절 가능한지 확인할 예정
- 파라미터 옵션 두어 사용자 친화적으로 구성
- 상호작용할 수 있는 Interactive
- 드랍다운 or 체크박스?
- 상호작용할 수 있는 Interactive
Ⅱ. WHO
시계열 데이터로 항공 데이터와 같이 볼 수 있도록 그래프 구성
추가적인 시각화 디자인 필요, 자료 참고예정
개발일정(초안)
- 12/20 수 - 항공데이터 크롤링 설계 및 데이터 생성 / 전처리 및 정제
- 12/21 목 - (오전 : 학교시험으로 부재) 오후 : WHO 데이터 전처리 및 정제 + Tableau 디자인 구상
- 12/22 금 - Tableau 시각화
- 12/23 토 + (미완료건 보완)
- 12/24 일 + (미완료건 보완)
- 12/25 월 - Tableau 시각화 및 검토
- 12/26 화 - 최종 검토 후 Deadline
1:1 면담시 질문사항
0. 주제
EDA에 초점을 맞추다보니, 공공데이터 API 크롤링하는 것과 성격이 좀 많이 다른 듯 한데 괜찮을까요?
(API로 자료 수급이 불가능해 셀레니움과 엑셀 다운으로 데이터를 구하는 중입니다)
1. 아이디어 유사성 질문
항공 데이터 활용법 계획 후 검색하던 중 보스턴 컨설팅 그룹의 보고서를 보게되었습니다.

좋은 예시로 보고 필요한 기법이 있으면 활용하려고 합니다.
이럴 경우 유사성이 보일 것같아 걱정이 되는데 개인의 인사이트를 반영한 그래프와 해석을 넣으면 괜찮을까요?
2. 데이터 크롤링 방식
셀레니움으로 데이터를 못받게 되는 경우, html로도 받는 방법이 있는지 궁금합니다.
3. 디자인 툴
미리 틀을 잡아두고 하는 편인데, 대시보드나 UI를 설계하는데 도움이 되는 툴이 있을까요?
'일별 학습일지' 카테고리의 다른 글
| 12/21 :: 개발 1 (0) | 2023.12.22 |
|---|---|
| 12/21 :: Ideation 2 (0) | 2023.12.21 |
| 12/18 :: 실시간 (0) | 2023.12.18 |
| 12/13 :: 실시간 (0) | 2023.12.13 |
| 12/12 :: IF, for, while (0) | 2023.12.12 |


